
Financial bubbles normally burst when confidence in the reasonableness of valuations tips among a sufficient number of market participants. This point is typically reached when liquidity becomes scarce or when confidence breaks down that the economic returns on investments will match their financing. It is impossible to predict precisely when or why a bubble will burst, because collective confidence, or lack of confidence, cannot be measured unambiguously. There are, however, indicators of underlying confidence, in the form of liquidity conditions and risk appetite, that are likely to weaken before the bubble itself bursts. This is the second of three blog posts on identifying financial bubbles, this time focusing on long-term financial indicators. The final blog post will provide examples of short-term indicators.
There is an asymmetry between investment and financing that creates bubble risk
AI has enormous transformative potential for the economy. Much today nevertheless suggests that it will take several years longer for this potential to translate into economic growth than the financing is scheduled to mature, as discussed in the previous blog post..
This classic “duration mismatch” between investment and financing is similar to what emerged during the dot-com boom and earlier industrial revolutions, such as the invention of the railway. The economic effects do materialise, but they arrive later than we initially expect. We are often slower at converting technological opportunities into higher economic productivity than we imagine when assessing the potential of a vision and deciding to invest. At the time of investment, we choose a financing structure whose payments and maturities reflect our expectations about when the economic returns will be realised.
AI's transformative effect on the economy may still be very large. The risk is nevertheless increasing that a larger AI bubble is building up and could burst in the meantime.
The timing of a bubble burst is highly uncertain …
When an intermediate bubble will burst is, however, as uncertain as ever. There is no unambiguous way of measuring the point at which collective confidence turns into doubt. Doubt typically builds over an extended period, after which a bubble can be triggered by increasingly small events. Drops that eventually cause the cup to overflow.
Among long-term indicators of whether deeper doubt is building, it is useful to distinguish between general market indicators and more specific indicators for the AI sector. The first group indicates broad confidence in the ability of major market participants to meet their financial obligations. This can typically be addressed through liquidity support. The second group indicates whether there is a deeper doubt about the transformative effect of AI technology on economic earnings. For this group, liquidity support will typically only postpone and modestly mitigate a valuation correction.
… but the higher the valuations, the greater the potential disappointment
All financial prices, such as interest rates, essentially express the market's assessment of risk (doubt), particularly over time.
- Buying both shares and bonds is essentially equivalent to lending money to other market participants in exchange for future payment streams. The longer it takes for an investor's lending to be repaid, the more sensitive the investment becomes to changes in expectations.
- The higher the relative value of a share, for example its forward P/E, the more convinced the investor is that the company's expected returns will materialise.
- High valuations therefore reflect greater sensitivity to disappointments, which can rapidly spread into systemic doubt.
Three long-term indicators are particularly worth monitoring for broader confidence
It is worth monitoring whether the following three indicators begin to rise and approach levels seen during previous crises:
- Expectations for the economy, for example through the spread between short- and long-term interest rates, such as 2-year versus 10-year government bonds. If long-term yields begin to rise significantly relative to short-term rates, this may reflect, among other things, rising inflation or growth expectations and changing risk premia. Conversely, a sharp flattening or inversion may indicate that the market expects significant rate cuts by central banks as a result of weaker economic prospects..
- Confidence that credit risk will remain stable, broadly expressed through the spread between investment-grade (IG) and high-yield (HY) bonds. Investment Grade (IG) is typically a requirement for institutional investors such as banks and pension funds to be permitted to invest in bonds. If credit spreads widen, this indicates that investors are demanding a larger risk premium to finance companies with lower credit quality. If downgrades also increase broadly, this may indicate that professional analysts at rating agencies believe that companies' resilience to downturns is weakening..
- Confidence in banks' ability to meet their obligations. Banks are normally the financial actors best equipped to assess credit risk. This applies both to companies and individuals and to banks themselves.
- On this basis, banks lend large sums to one another every day through the interbank market, or borrow from central banks through the repo market, thereby continuously meeting institutional liquidity requirements for their resilience.
- Their interest-rate premia in the interbank market are normally small and marginal. If these premia therefore begin to rise, this indicates that banks are beginning to lose confidence that lending to other banks is low-risk.
- During the financial crisis, the FRA/OIS measure was perhaps the most important daily indicator of confidence. Today, the Euribor-OIS spread is a relevant measure for the euro area..
Today, the levels of all three indicators suggest broad calm and confidence in the market.
Long-term indicators relating to AI …
The next group of long-term indicators suggests whether doubts are beginning to emerge about the valuations and long-term creditworthiness of the primary AI players.
This is particularly relevant today because the AI boom is so large. Hyperscalers' capex relative to GDP, for example, exceeds residential construction relative to GDP ahead of the financial crisis. It also exceeds telecom investment relative to GDP ahead of the dot-com crash.
… focus particularly on three indicators
- Confidence in AI's transformative effect. Today, only the large AI companies, the Mag7, are increasing their earnings expectations, as shown below. The other 493 companies in the S&P 500 generally have unchanged expectations. This suggests that the economic gains from AI remain several years into the future. This raises the possibility of a duration mismatch and therefore a financial bubble.
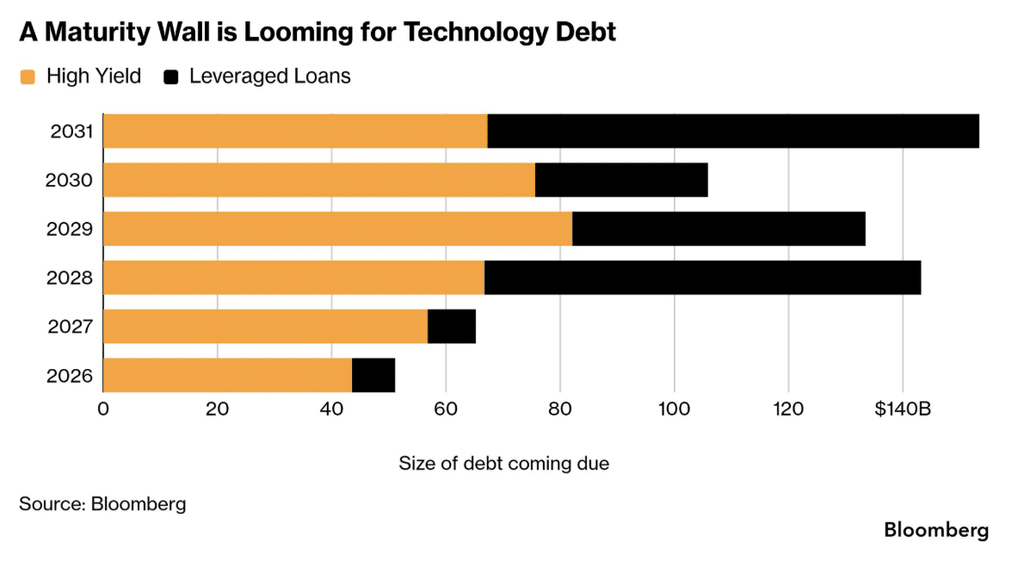
- The doubt does not necessarily have to be triggered yet. AI debt maturities are generally concentrated from 2028 onwards , as discussed below. This debt could nevertheless become difficult to refinance unless the AI companies' cash flows and customer lock-in have increased substantially by then.
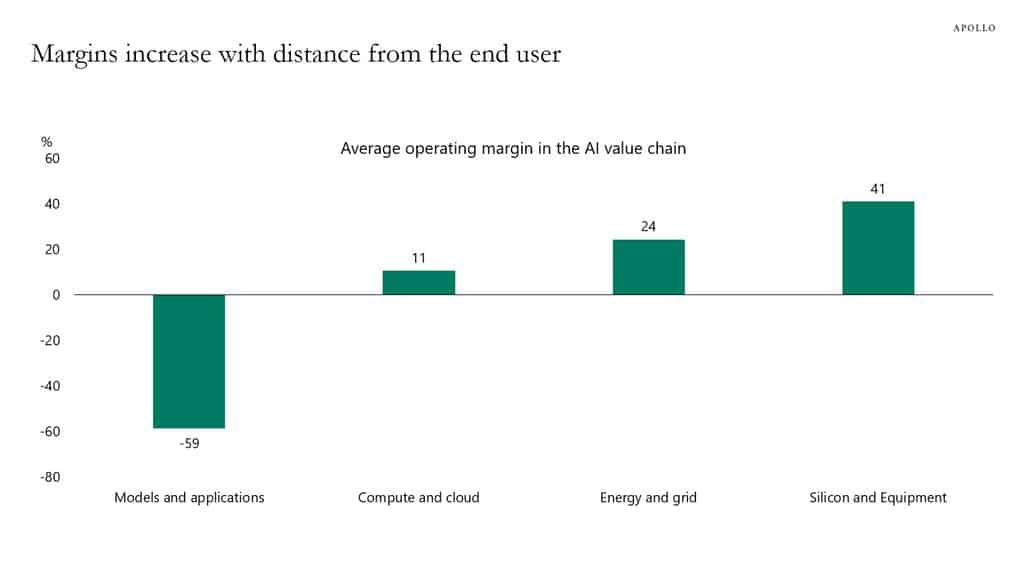
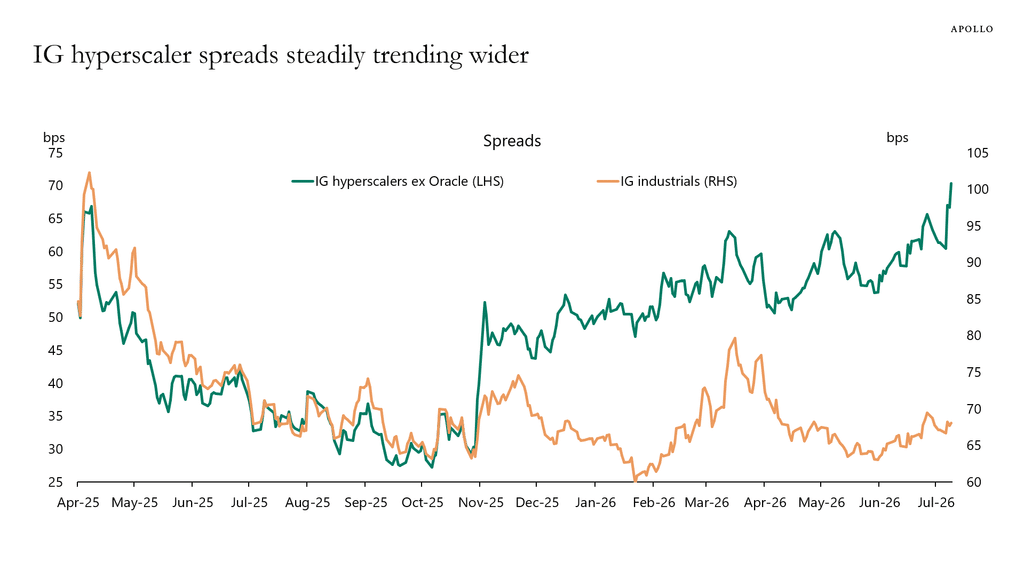
- Doubt about the creditworthiness of AI companies. Hyperscalers account for the majority of the AI investment boom that is driving most of the growth in US GDP. Their financing, however, increasingly relies on long-term debt of declining quality and, increasingly, on private credit. Financing is therefore increasingly being provided by more risk-tolerant sources, which are already attracting growing concern from several central banks, including the Bank of England. This points to a general increase in doubt among professional lenders about the creditworthiness of hyperscalers.
- This doubt is particularly visible in the IG spread between hyperscalers and other industrial companies, as shown below. The spread indicates the price of protection against default. These spreads are now rising steadily, although not yet explosively or above previous levels, as shown below.
- Signs of emerging refinancing problems. When loans are refinanced, temporary periods of double borrowing arise. This is similar to what most private individuals experience when buying a home. Within private credit, a special form of interim financing is often agreed in which interest payments are deferred during this period through Payment-in-Kind (PIK) arrangements. The share of loans using this mechanism has increased from 7% in 2021 to 11% at the end of 2025. This has raised questions about whether the increase conceals shadow defaults, loans formally classified as performing, but where the borrower is in practice no longer able to meet the original payment terms.